Introduction
This is a Python module to calculate an incoherent scatter spectrum based off of Kudeki and Milla’s 2011 IEEE Geophysics paper.
Kudeki, E.; Milla, M.A., “Incoherent Scatter Spectral Theories—Part I: A General Framework and Results for Small Magnetic Aspect Angles,” Geoscience and Remote Sensing, IEEE Transactions on , vol.49, no.1, pp.315,328, Jan. 2011
Like the model covered in the paper the software can calculate a spectra given, any magnetic aspect angle not perpendicular to B, any number of ion species, and the collision frequencies associated with those ion species. As the magnetic aspect angles get closer to perpendicular to B, usually < 1 degree perp to B, more and more calculations are needed for the Gordeyev to converge.
Install
The newest versions of the software are automatically uploaded to Anaconda.org and Pypi so
# use conda or mamba to install
conda install swoboj::isrspectrum

# Using pip to download and install directly.
pip install isrspectrum
The user can also create a local copy and use pip to install and run the software:
# download and install code locally.
git clone https://github.com/jswoboda/ISRSpectrum.git
cd ISRSpectrum
pip install -e .
Usage
The Examples directory has a number of cases that show how to use the software. The basic way to use the code is to import the Specinit object. Then the object can then call one of three different methods depending on how your parameters are defined. For example the getspecsimple method takes physical electron density, temperature, ion temperature, velocity and the species along with their concenterations. The getspecsep and getspec methods uses a numpy array to hold physical information about the spectra. See the documentation for more details.
Example
This example shows how to use the Specinit class and then create a spectrum using the getspecsimple, getspecsep and getspec. The two functions getspecsimple and getspecsep take the inputs different but calculate collision frequencies based off of the physical inputs, i.e. density, temperture, ion species. The method getspec takes as an input, in the datablock array, the collision frequency so the user can have more control over defining the frequency
import numpy as np
import scipy.constants as spconst
from ISRSpectrum import Specinit

spfreq = 50e3
nspec = 512
ISS2 = Specinit(centerFrequency = 440.2*1e6, bMag = 0.4e-4, nspec=nspec, sampfreq=spfreq,dFlag=True)

ti = 1e3
te = 1e3
Ne = 1e11
Ni = 1e11
vi = 0
mi = 16
species = ['O+','e-']

omeg,spec = ISS2.getspecsimple(Ne,te,ti,['O+'],[1])
datablock = np.array([[Ni,ti],[Ne,te]])
(omega,specorig,rcs) = ISS2.getspecsep(datablock,species,vi,alphadeg=90,rcsflag = True)
Nui = 0 # Collision frequency of ions
Nue = 0 # Collision frequency of electrons
datablock_s = np.array([[Ni,ti,vi,1,mi,Nui],[Ne,te,vi,-1,1,Nue]])
(omega,specorig,rcs) = ISS2.getspec(datablock_s, rcsflag = True)
The exaample spctrum is shown below. This is the same across all of the different methods.
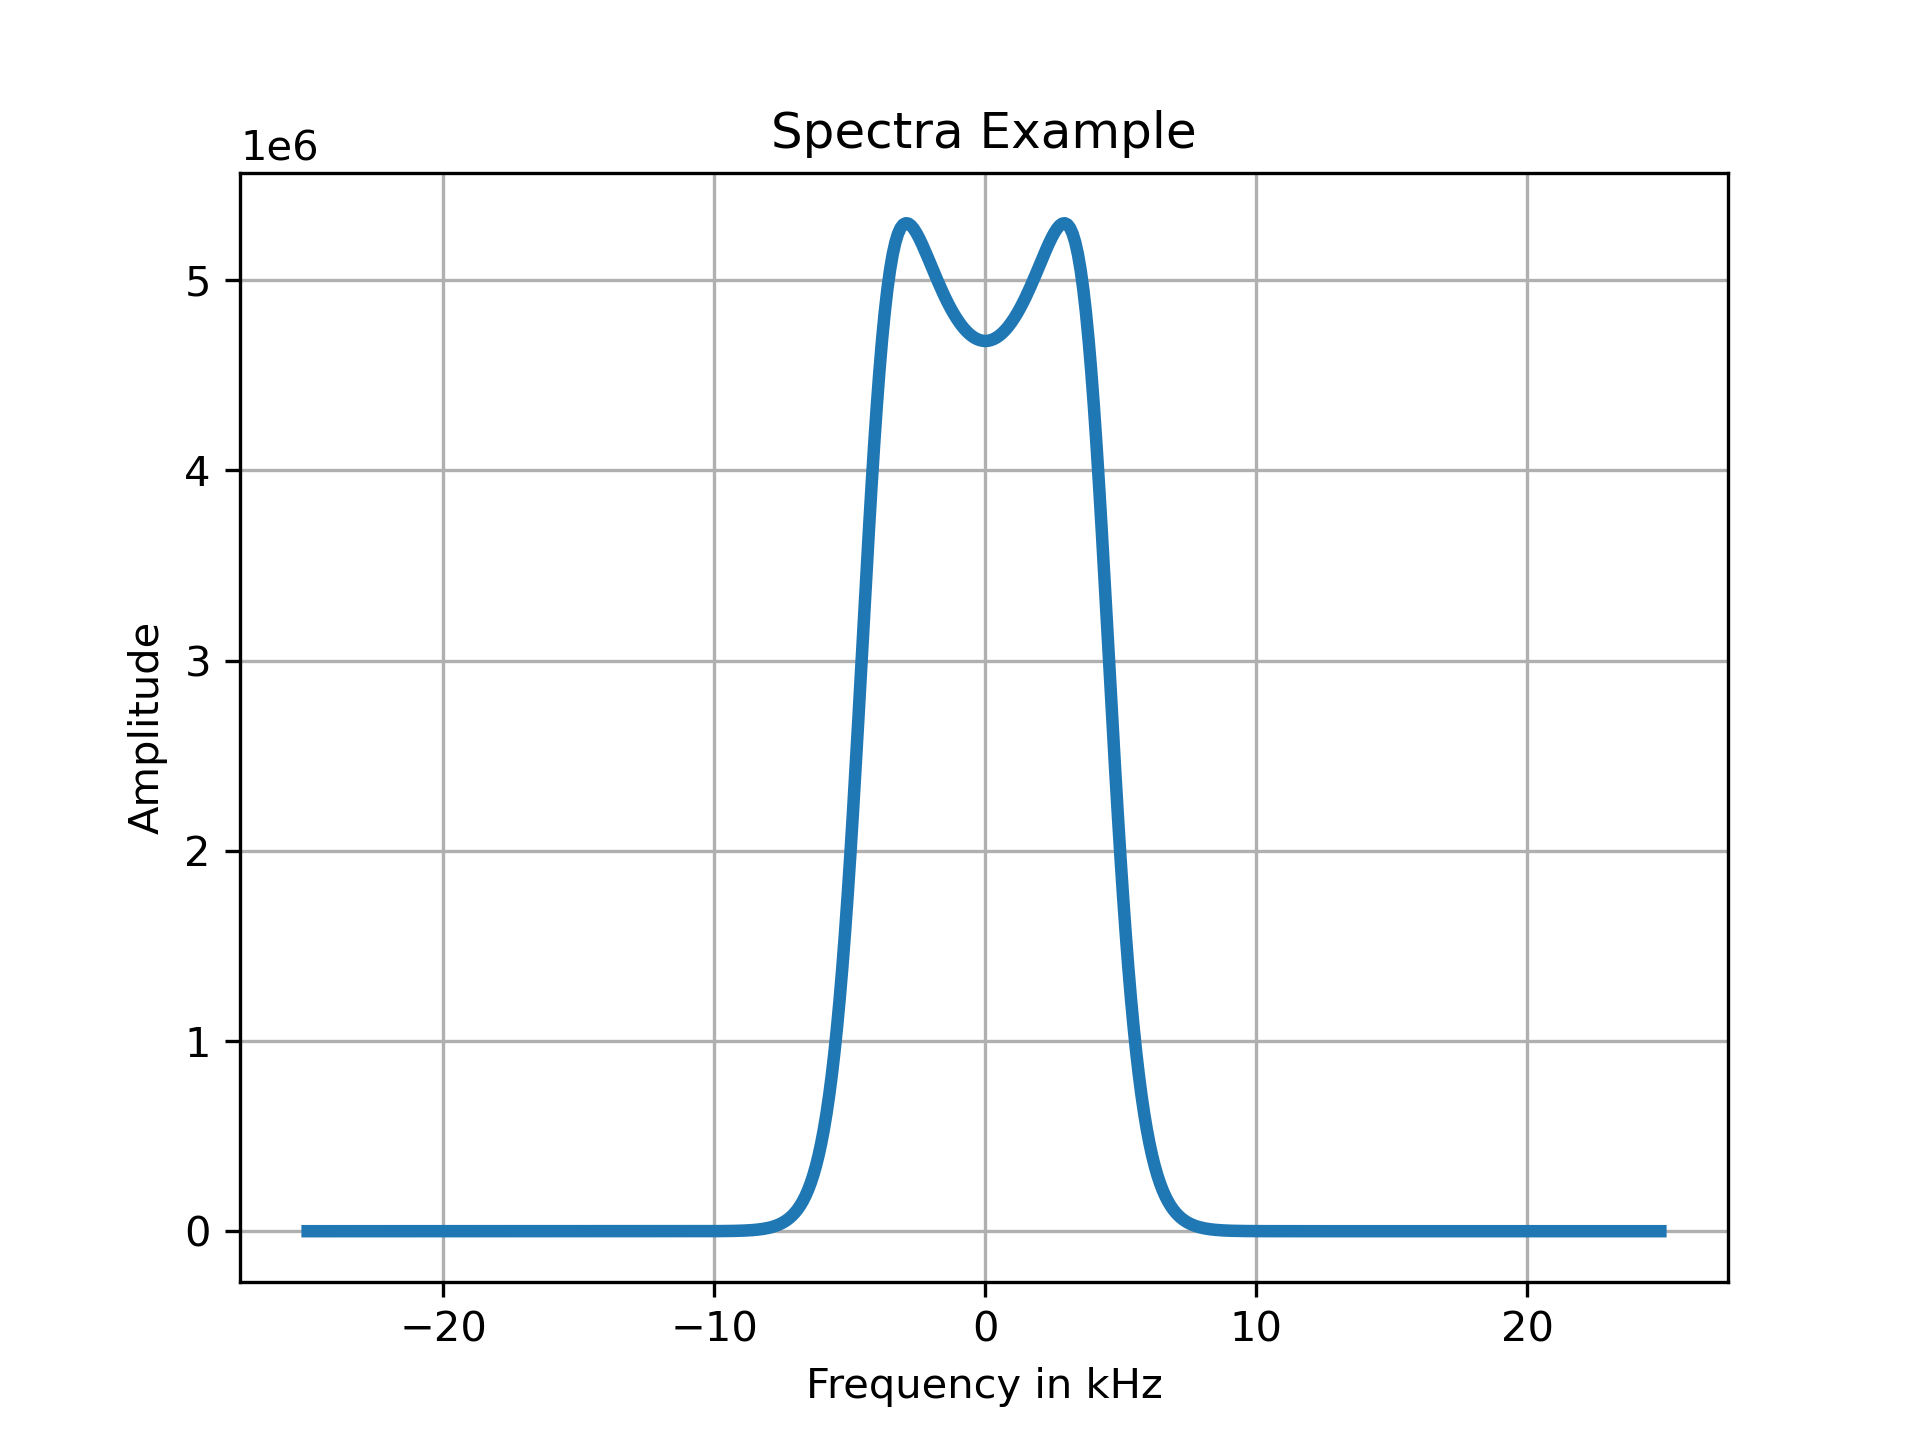
Example output spectrum
Using Plugins
Plugins can be used with the getspec method. All of the plugins should have an identifier which will be in the file name after gord_ part in the filename. The example from above can be expanded, first lets increase the ion collision rate to 10kHz and use the default plugin for the Gordeyev integral calculation:
Nui = 10e3
datablockdefault = np.array([[Ni,ti,vi,1,mi,Nui],[Ne,te,vi,-1,1,Nue]])
(omega,specorig_default,rcs) = ISS2.getspec(datablockdefault, des_plug='default', rcsflag = True)
We can use a different plugin, labelled as simple, to perform the same calculation but we have to modify the inputs. First the datablock has a different format. The format followed that each row will have a set up of [Ns, Ts, qs, vs, ms], where Ns is species number density in m^-3, Ts is the species temperature in K, vs is the Doppler velocity in m/s, qs is the charge, and ms is the atomic weight in kg. One note of difference is the atomic weights are defined differently between the default and simple pluggin: the default uses the atomic mass unit. These standards can be found in the doc strings of the functions.
datablocksimp = np.array([[Ni,ti,vi,1, mi*spconst.m_p],[Ne,te,vi,-1, spconst.m_e]])
(omega,specorig_simp,rcs) = ISS2.getspec(datablocksimp, des_plug='simple', rcsflag = True)
The resulting spectra are shown below. As a general note the terms in the datablock numpy array are generally terms that can change across different species, e.g. density, temperature, mass, etc. Other inputs to the getspec method can include magnetic field angle, magnetic field strength etc. There is a kwargs input for the plugins so needed options are avalible.
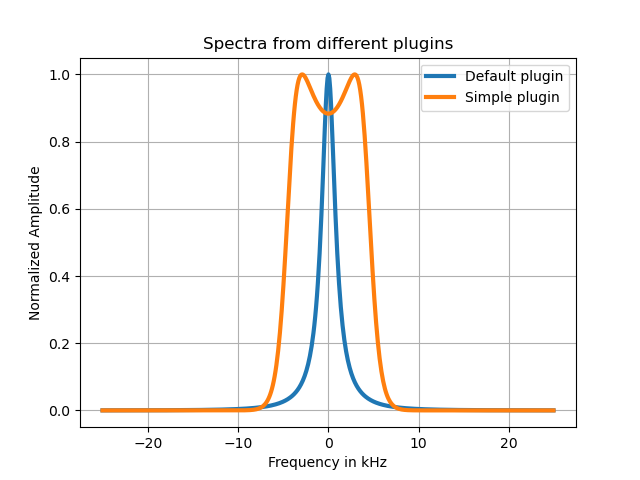
Example using different plugins